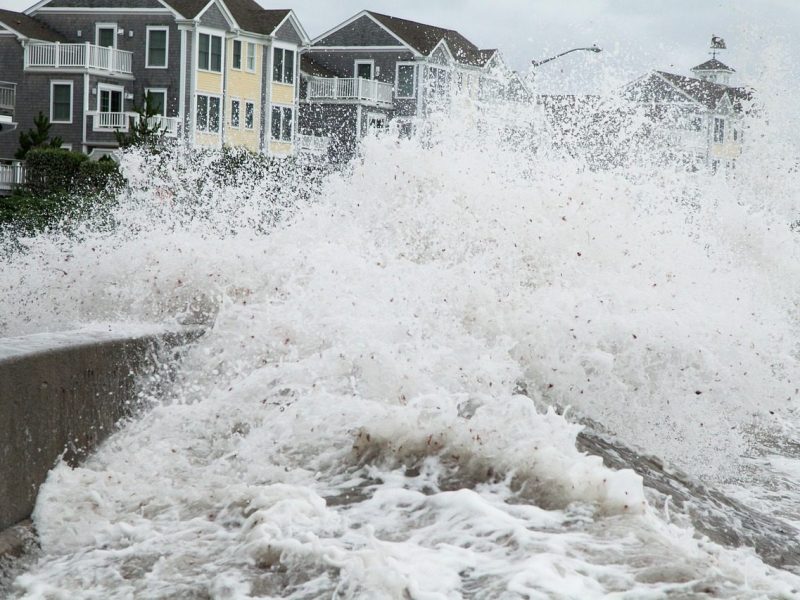
For anyone with a house, bach, or section near Whangamata’s ocean beach or harbour, coastal hazard mapping has become a practical question rather than a council oddity. The overlays mark where storm surge, long-term flooding and erosion may reach, and they feed into insurance quotes, building consent conditions, and decisions about beach access. Understanding the national science behind them can help you read your own property’s position without guessing.
Why coastal hazard lines are more than a single flood zone
A coastal hazard overlay is not one line drawn on a map. It combines local topography, tidal records, storm climatology and projections of sea-level change to identify areas that could be inundated during an extreme event or lost gradually through shoreline retreat. In practice, the maps divide risk into bands tied to planning horizons, so a property can be assessed for current conditions and for a changing coast. For Whangamata, with its harbour entrance, ocean beach and low-lying dune areas, the same logic applies, but the exact boundaries depend on local surveys and models.
The starting point for any such map is the tidal and non-tidal behaviour of water. Hydrologists distinguish between tidal reaches, where the sea’s influence is felt, and non-tidal reaches further upstream, with a tidal limit marking the change. Storm surge pushes water beyond the normal high-water mark, and the worst flooding occurs when a surge coincides with a high spring tide. That interaction is central to coastal inundation mapping.
The NIWA science behind the local lines
Much of the national climate and coastal science used by New Zealand councils comes from NIWA, the National Institute of Water and Atmospheric Research. NIWA was established in 1992 as a Crown Research Institute and has staff across 16 locations in New Zealand and one overseas, with a head office in Auckland and a regional office in Hamilton. Its research includes natural hazards such as storm surge, tsunami, flood and earthquake, as well as coastal ecology and climate change. In July 2025 NIWA became Earth Sciences New Zealand in a merger with GNS Science.
Recent NIWA work is directly relevant to local risk assessments. In October 2026, NIWA announced that researchers had used generative AI to produce high-resolution climate projections at a scale previously out of reach, providing a window into future changes in rainfall, temperature and extreme weather events. The same month, the 2026/27 Tropical Cyclone Outlook released by NIWA projected that the Southwest Pacific could experience at least four severe tropical cyclones reaching category 3 or higher. While Whangamata is not in the tropics, distant cyclones can generate swell and storm surge along the New Zealand coast, and NIWA’s El Niño 2026 guidance is part of the seasonal picture that feeds local planning.
How storm surge and sea-level rise combine
Storm surge is the temporary rise in water level caused by low atmospheric pressure and strong onshore winds. It rides on top of the tide, so a surge that once caused minor overwash may, with a modest sea-level rise, reach areas that were previously safe. NIWA’s research programmes cover storm surge and floods under the natural hazards banner, and its monitoring networks and climate models feed into regional-scale projections that councils translate into property maps. At Whangamata, the harbour entrance, the ocean beach and the low-lying areas behind the dunes are the kinds of places where these layers tend to concentrate, but no single published map from the available material gives the exact boundary for every address. The overlay lines are set by councils after local modelling, and they can change with new LiDAR surveys and updated climate scenarios.
What the maps mean for insurance and building consents
If a coastal hazard overlay applies to your property, it does not automatically mean you cannot build or insure it, but it changes the information you need. A Land Information Memorandum (LIM) will list any hazard notations affecting the land, and a bank or insurer may ask about them. Building consents in a coastal hazard zone may require a higher finished floor level, set-backs from the dune or shoreline, or engineering reports showing the structure can withstand wave action and erosion. Some insurers ask for detailed risk assessments for the most exposed locations. The key is to check the current overlay for your specific address, because the boundaries can be revised.
Public land is also affected. Dunes, reserves, boat ramps and car parks near the beach can all fall within the mapped zones, and councils use the overlays when deciding where to locate or relocate infrastructure. In Whangamata, the surf club, ocean beach accessways and harbourfront paths are the sorts of assets where erosion and storm-surge exposure matter. The maps do not close the beach; they shape how the shoreline is managed, where sand is replenished, and what development is allowed behind the foreshore. If a storm erodes a car park or walking track, the map helps the council plan a managed retreat rather than an ad hoc rebuild.
How to check your own property and what is not yet known
The most reliable way to see whether a coastal hazard notation applies to a Whangamata property is to request a LIM from Thames-Coromandel District Council and to view the operative district plan maps. Waikato Regional Council also publishes coastal information, and NIWA’s website carries the national climate and storm outlooks that feed local assessments. If you are buying, ask the agent directly about coastal hazard overlays and have your lawyer check the title and LIM. If you already own, periodic checks are worthwhile because the maps can be updated after new modelling.
What is not yet clear is the specific mapping release for Whangamata: the available public material does not include the council’s current overlay boundaries, planning timeframes or affected property counts. That information sits with Thames-Coromandel District Council and Waikato Regional Council, and it is best obtained through a LIM or the council’s duty planner. Treat any overlay as a planning tool, not a forecast of a particular storm: it shows where risk is concentrated, and it gives you the starting point for asking the right questions.